


Turn complex data
into clear, compelling visuals
that tell a powerful story.
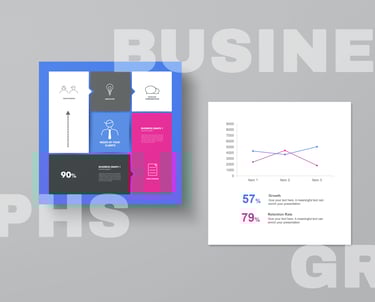
Our Visualizing Data service transforms raw information into intuitive charts, infographics, and slide designs that engage your audience and drive understanding. We go beyond standard graphs to create custom visual narratives that highlight key insights, trends, and outcomes—whether for internal reporting, investor decks, or client-facing presentations.
This service includes:
We combine design expertise with a strategic understanding of information hierarchy, ensuring every visual not only looks good—but works hard to make your message memorable and actionable.
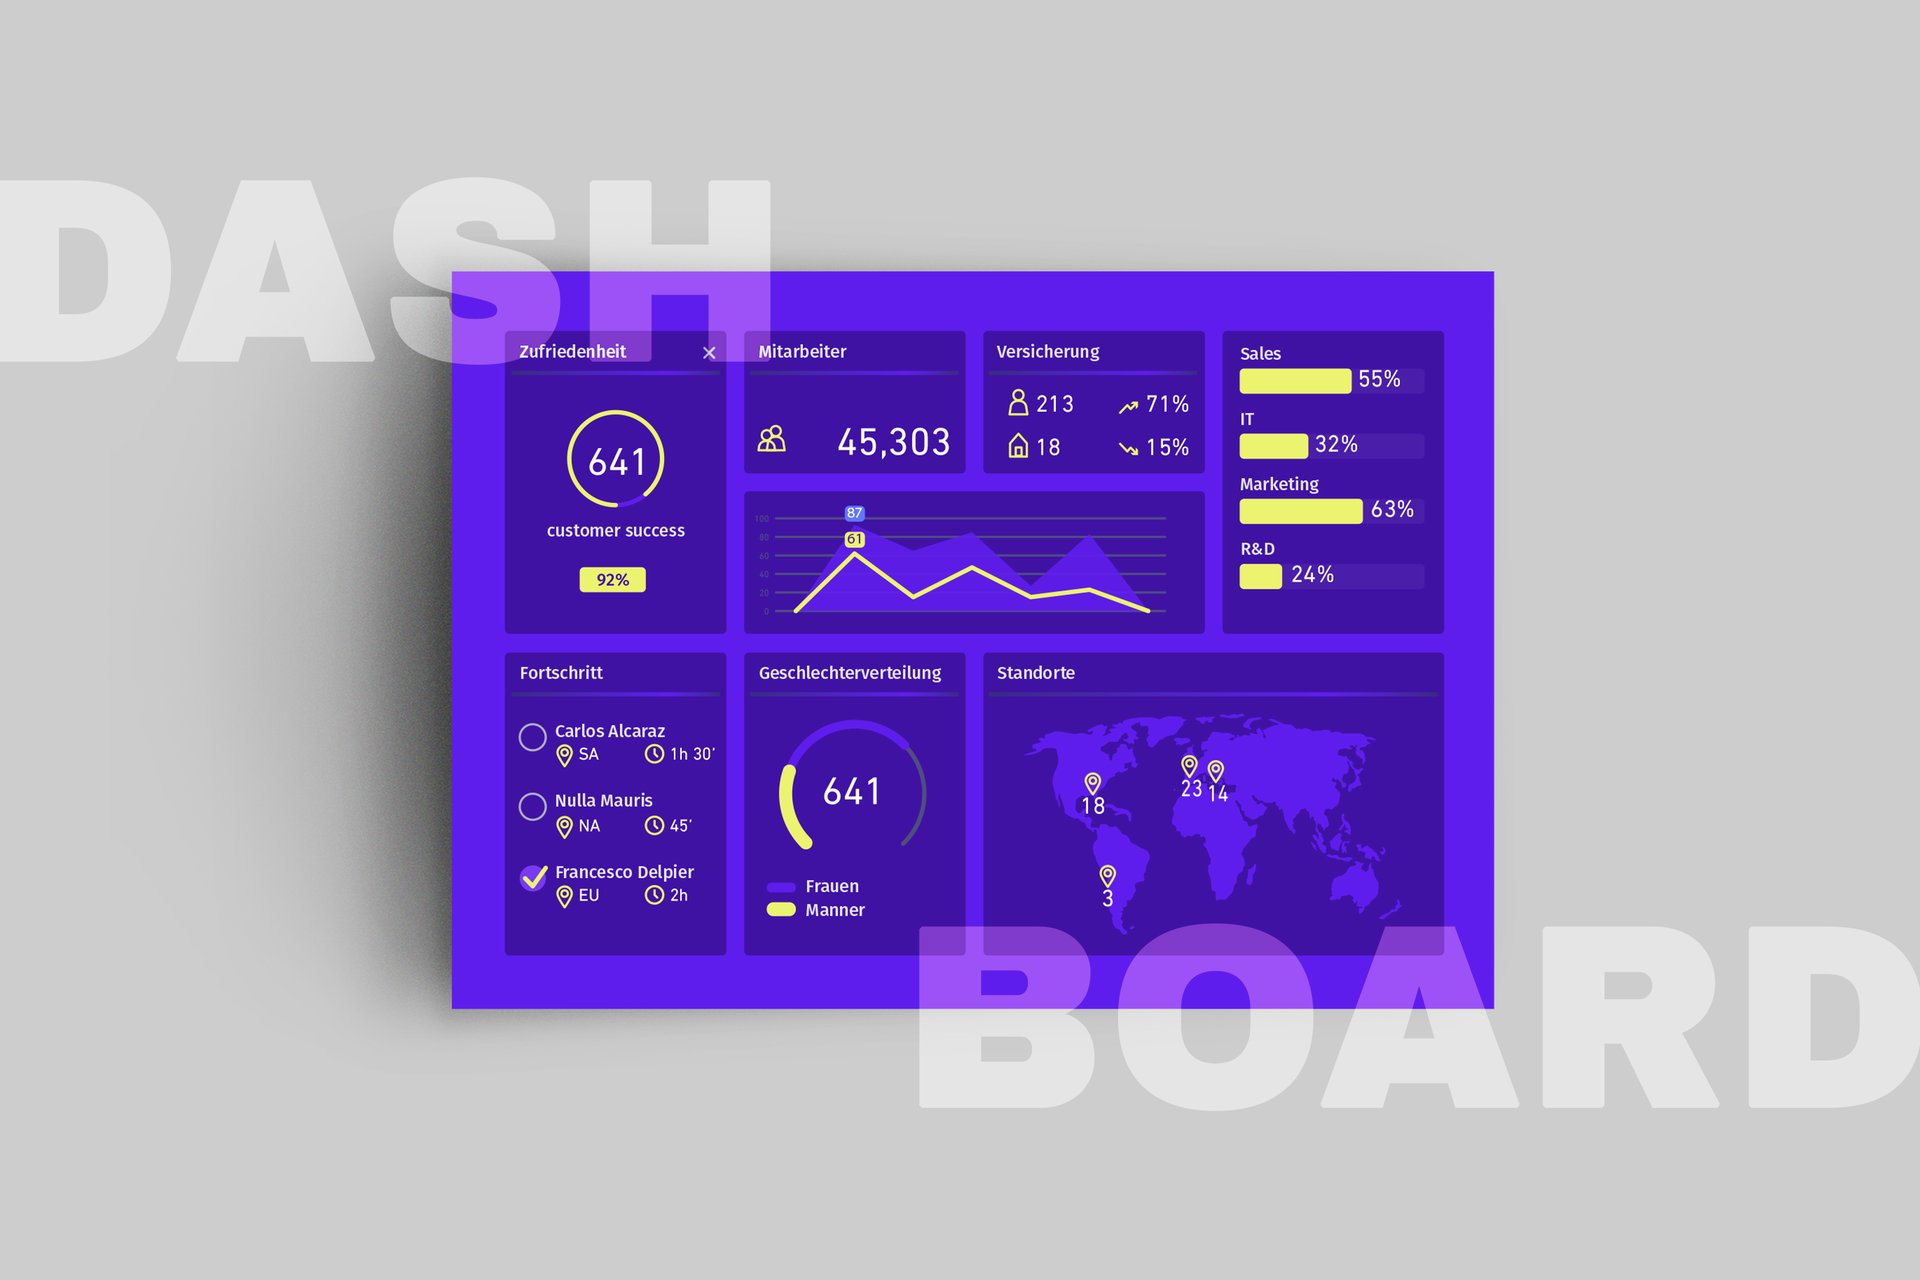
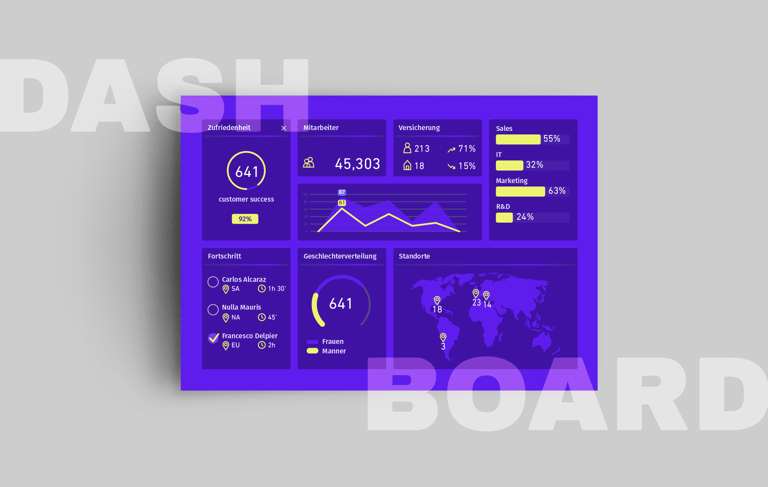
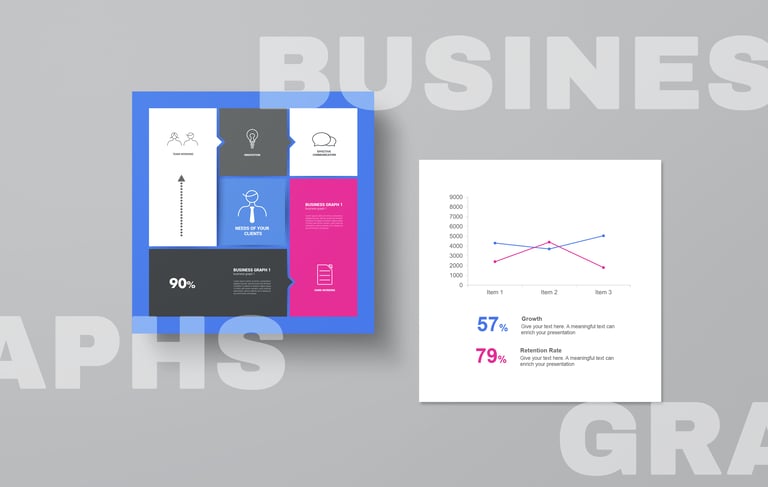
Custom-designed data visuals (charts, diagrams, infographics, etc.)
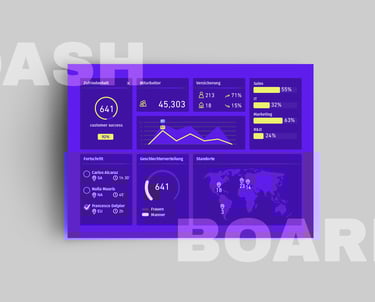
A branded slide template system to ensure consistency across presentations
Multiple revision rounds for accuracy, clarity, and style alignment
Sample slides demonstrating best practices for data communication
Turn complex data
into clear, compelling visuals
that tell a powerful story.
Our Visualizing Data service transforms raw information into intuitive charts, infographics, and slide designs that engage your audience and drive understanding. We go beyond standard graphs to create custom visual narratives that highlight key insights, trends, and outcomes—whether for internal reporting, investor decks, or client-facing presentations.
This service includes:
We combine design expertise with a strategic understanding of information hierarchy, ensuring every visual not only looks good—but works hard to make your message memorable and actionable.
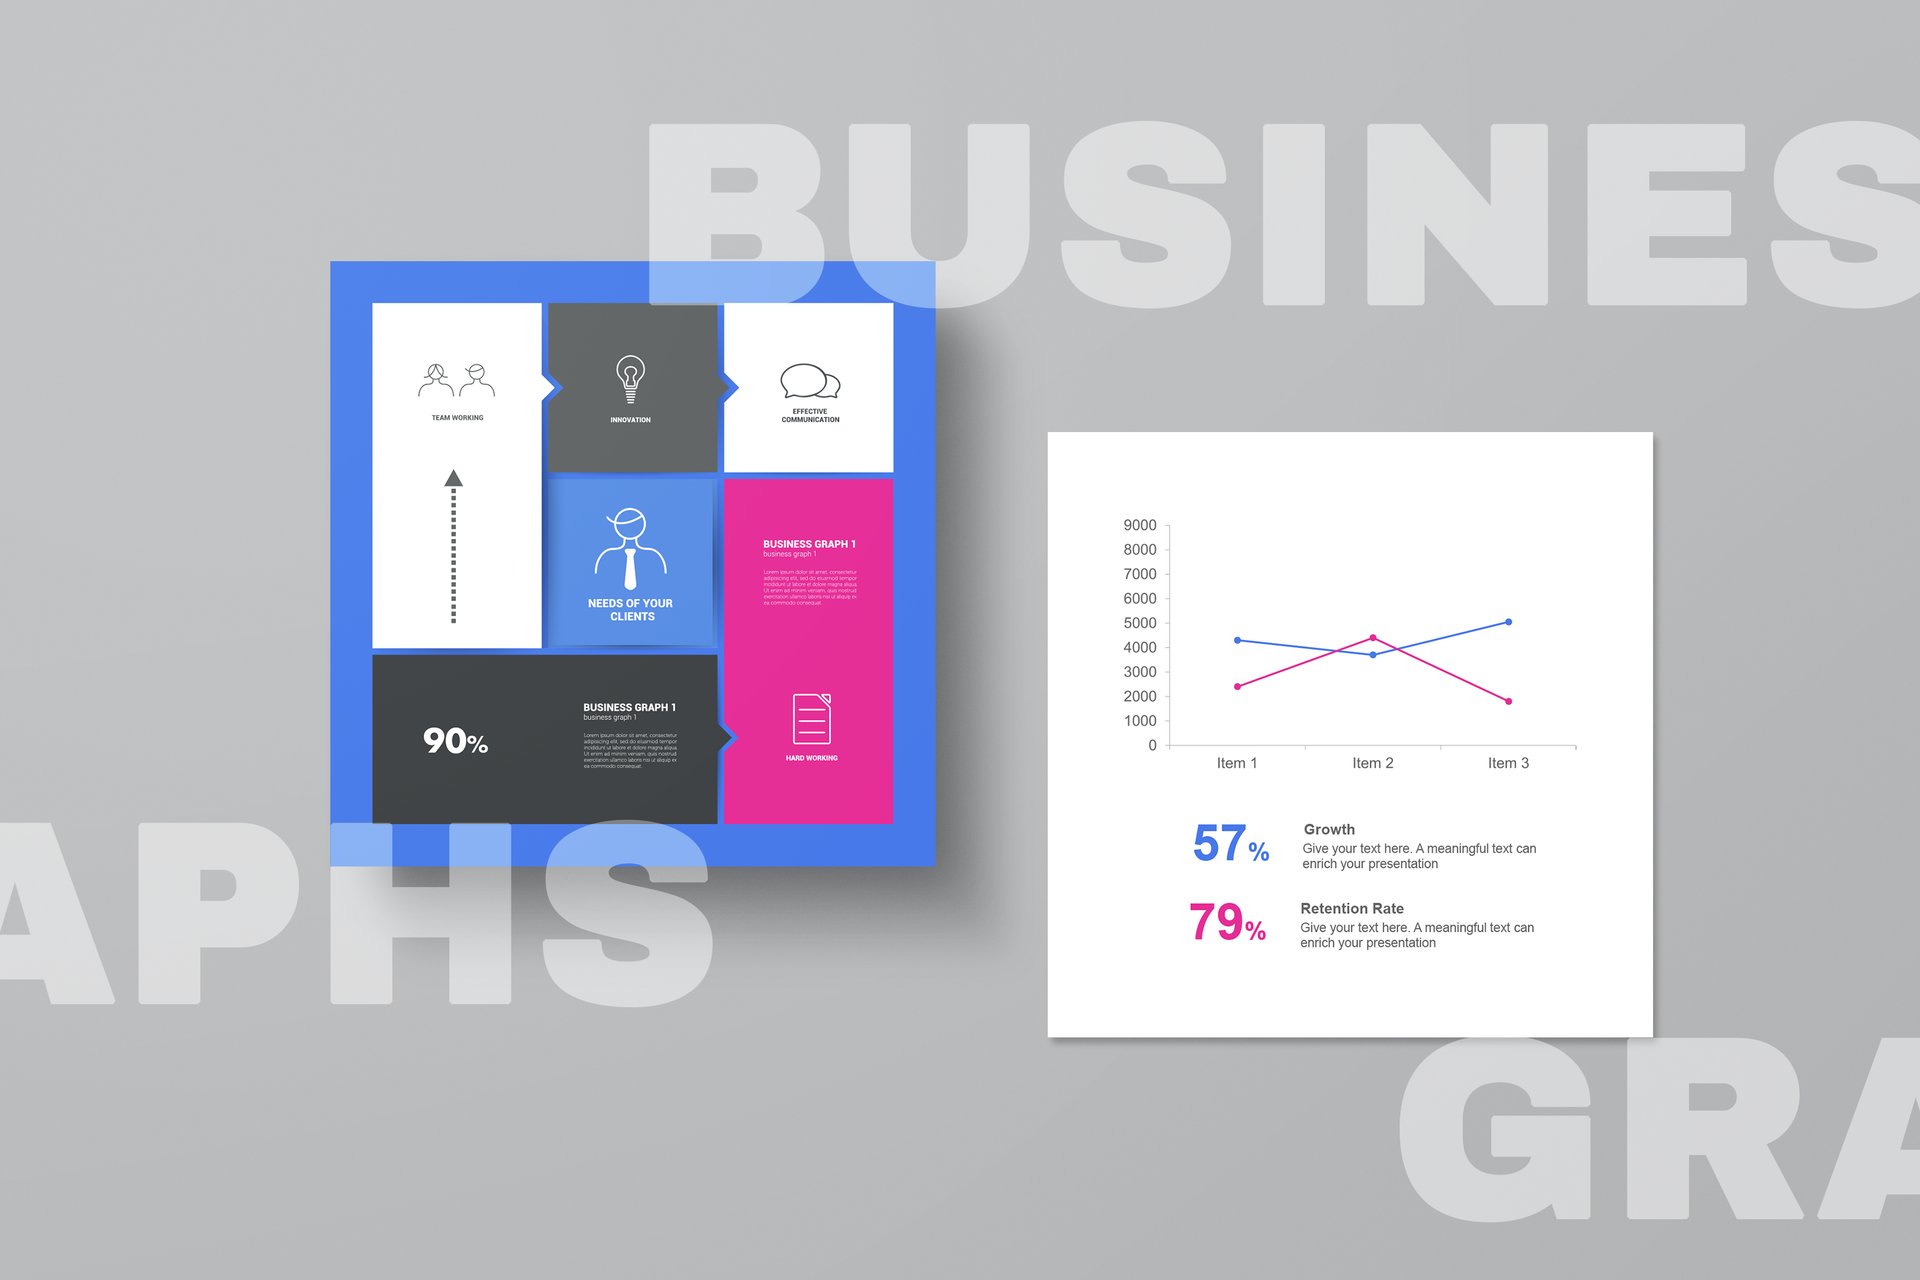
Custom-designed data visuals (charts, diagrams, infographics, etc.)
Multiple revision rounds for accuracy, clarity, and style alignment
Sample slides demonstrating best practices for data communication
A branded slide template system to ensure consistency across presentations


Address
Blütenstraße 23
4040 Linz, Austria
Contact
info@henu.at
Transform your ideas into stunning visuals.

